Most analytics platforms have a fundamental honesty problem, and it has nothing to do with accuracy of the underlying data. It has to do with the visual treatment of numbers.
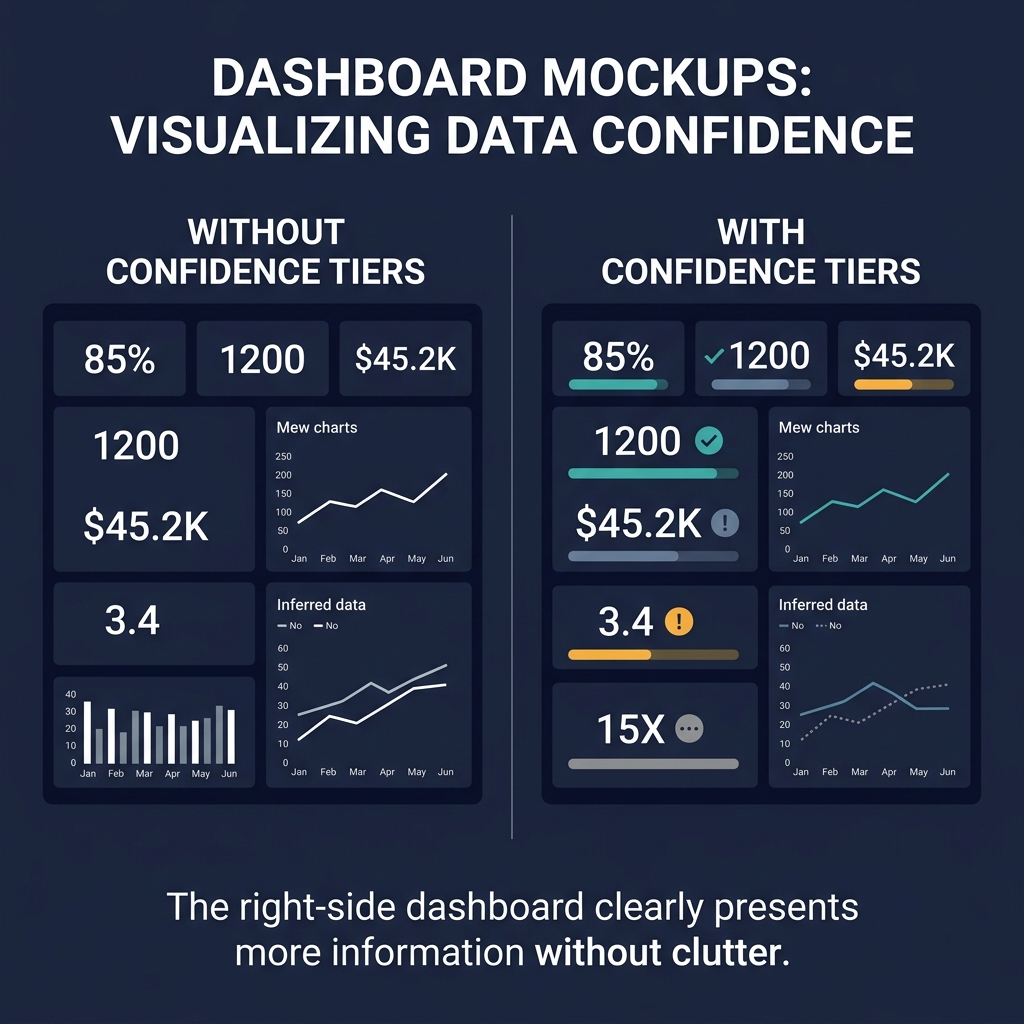
A dashboard shows a distributor's revenue at USD 4.2M, their gross margin at 18%, their outlet count at 840, their DSR productivity at 12 visits per day. Every number looks identical - same font, same weight, same styling. Every number conveys the same apparent confidence. The viewer treats all of them as equivalent inputs to their decision.
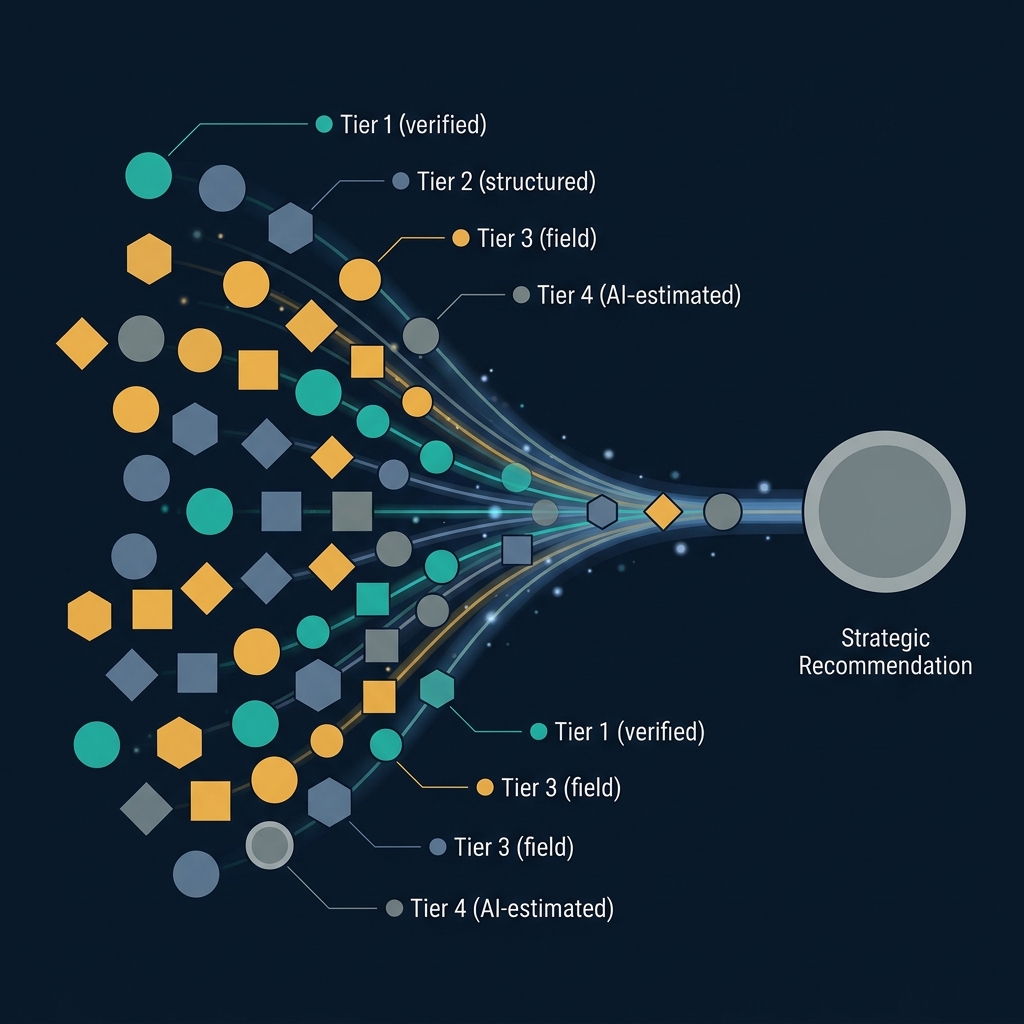
But they are not equivalent. The revenue number comes from the tenant's ERP system - it is Tier 1 data, audited, clean, essentially error-free. The gross margin number is derived from ERP data combined with a landed-cost model - Tier 2, structurally sound but dependent on assumptions that may need updating. The outlet count comes from the distributor's self-report - Tier 3, field-derived, typically 20–40% overstated in my experience. The DSR productivity number is an AI estimate based on territory characteristics - Tier 4, a modeled value with no ground truth.
The viewer who treats all four numbers identically is making decisions that rest on Tier 4 assumptions while feeling the confidence of Tier 1 data. This is how bad decisions get made in executive rooms where everyone is smart and everyone is misled by the interface.
The fix is structural, not cosmetic. Every piece of data in the system carries a confidence tier as a first-class attribute. Every derived metric inherits the minimum confidence of its inputs. Every visualization shows the confidence tier next to the number, in a way that is immediately legible but not visually dominant. Every strategic conclusion carries a composite confidence badge that tells the viewer what basis of truth underlies the recommendation.
This is not a UX flourish. It is a commercial discipline with three downstream effects.
First, it changes which decisions get made and which get deferred. When the Commercial Director sees that a territory exit recommendation is built on Tier 3 outlet data and Tier 4 DSR productivity assumptions, they correctly pause. Not because the recommendation is wrong, but because the confidence basis isn't strong enough for the magnitude of the decision. Either they invest in upgrading the data - commission a field research pass, validate the outlet universe, measure actual DSR productivity - or they accept the decision with eyes open. Either outcome is better than the alternative, which is making a territory exit decision that feels confident because the dashboard presented it confidently.
Second, it rewires the conversation with the client. Before confidence tiers, the conversation between a strategy team and a client team is often an unproductive argument about whose numbers are right. After confidence tiers, the conversation becomes: the AI estimate is Tier 4, we need Tier 3 or better to recommend action, here's what it would cost to upgrade, do we invest? This is a dramatically healthier conversation. It turns the question of data quality from a credibility battle into a resource allocation decision.
Third, it creates a natural path for improving the system over time. A tenant who sees that their most important strategic recommendations rest on Tier 3 and Tier 4 inputs has a clear investment case for better data capture. Better field forms. Better DSR data submission. Better ERP-to-analytics pipelines. Each investment upgrades specific fields from lower to higher confidence tiers, and the effect compounds over time. Without visible confidence tiers, there is no visible gap between current data quality and adequate data quality - so no investment case gets made, and the dashboards keep lying with the same veneer of confidence forever.
The design of confidence tiers has a few principles worth being explicit about.

Tiers should be small in number and clearly defined. Four tiers is about right. More than four and the distinctions become unclear. Fewer than four and the tiers don't capture meaningful differences in data provenance. Tier 1 is source-of-truth data (ERP, audited financials). Tier 2 is structured data submission (template-based, validation-applied). Tier 3 is field-derived data (DSR reports, outlet visits, commercial team observation). Tier 4 is modeled or AI-estimated data (no ground truth, derived from proxies). These four cover almost every type of input a commercial analytics platform encounters.
Confidence must propagate through derivations. If a metric is calculated from three inputs at Tier 1, Tier 2, and Tier 4, the output is Tier 4. It cannot be higher than its weakest input. This rule is non-negotiable and has to be enforced by the system - manual assignment of confidence tiers invites exactly the confidence-inflation that the whole system is designed to prevent.
The visual treatment must be legible but unobtrusive. Confidence tiers that dominate the interface create cognitive overhead. Confidence tiers that hide in tooltips create the same problem the interface had before - nobody notices them. The right treatment is a small colored badge adjacent to each number, positioned so that a quick scan reveals the confidence distribution of the dashboard without requiring explicit attention. This takes iteration to get right.
Every strategic output must carry a composite confidence badge. A deck with eight recommendations should show, for each recommendation, the overall confidence tier of its supporting analysis. The viewer should be able to see at a glance that Recommendation 3 is Tier 1-grade evidence while Recommendation 7 is Tier 4 - and calibrate their response accordingly.
There is a deeper point about honesty in analytics that confidence tiers gesture toward.
The cultural default in most organizations is that strategy and analytics teams present their work with maximum polish, which in practice means hiding uncertainty. A presentation that says "we estimate the market size at USD 400 million with a 95% confidence interval of 320 to 480" is penalized, in most rooms, as showing weakness. A presentation that says "the market is USD 400 million" is rewarded for decisiveness. The result is that polish becomes a form of dishonesty - the work is actually less certain than it appears, and everyone in the room is complicit in the performance of certainty.
Confidence tiers force a small but significant breach in that performance. They make it possible to show the number and the confidence basis together, in a way that doesn't read as hedging. "The outlet universe is 4,200 stores (Tier 2 confidence - derived from tenant ERP and third-party census data, validated against DSR route coverage)." That's a cleaner sentence than either the polished version or the full statistical caveat. It tells the reader enough to calibrate without drowning them in methodology.
An organization that commits to this pattern - confidence tiers on every number, visible in every output - becomes, over time, an organization whose decisions are better calibrated to the quality of the evidence underneath them. That's not a small thing. Most strategic errors come not from missing evidence but from misjudging how much weight the available evidence can bear. Confidence tiers address exactly that failure mode.
They also happen to make the software better. But the software is the vehicle for the discipline, not the point of it. The point is that the organization starts to tell itself the truth about what it knows and doesn't know. Everything else follows from that.
Implementing confidence tiers has a few gotchas worth naming specifically, because most first attempts stumble on them.
The first gotcha is tier gaming. If analysts or operators know that higher confidence tiers carry more weight in decisions, they have an incentive to upgrade the confidence tier of their inputs. "I saw this in the market so it's Tier 3 field-derived, not Tier 4 AI-estimated." Whether that claim is true requires actual field verification, but there's often no downstream check. Over time, the system drifts toward inflated confidence tiers because every individual upgrade seems reasonable and no one is enforcing the underlying provenance.
The fix is to define tiers by source rather than by claim. Tier 1 requires a specific ERP integration or audit trail. Tier 2 requires a specific structured submission template with validation rules. Tier 3 requires a specific field form with geolocation or photo evidence. Tier 4 is the default for anything that doesn't meet the above criteria. The source is verifiable; the claim isn't. Build the system around verifiable source, not claimed confidence.
The second gotcha is confidence fatigue. When every number on every screen carries a confidence badge, users stop seeing the badges. The visual signal becomes ambient clutter that doesn't register. The analytical honesty the tiers were supposed to enable is defeated by the same human attention patterns that made the original problem possible.
The fix is to make confidence visible selectively. Show tier badges on numbers that are critical to the decision being made on that screen, not on every number. Show composite confidence on the strategic conclusion, with the underlying tier mix available on click-through. Use the confidence system to enable attention rather than to distribute it - the user should notice when a key input is Tier 4 and ignore tier information on secondary numbers.
The third gotcha is tier propagation through derivations. A margin calculation takes revenue (Tier 1) and cost (Tier 2) and produces gross margin (should be Tier 2, the minimum). A viability calculation takes gross margin (Tier 2), working capital requirement (Tier 3), and hurdle rate (Tier 4, based on AI benchmarks) and produces an ROIC verdict (should be Tier 4). The system has to track this propagation automatically and apply it to every derived metric.
This sounds straightforward and is hard in practice. Complex calculations have many inputs. Some inputs are themselves derived from other calculations. The propagation logic has to walk the full dependency graph, and any node with a lower tier than the current working tier forces a downgrade. Getting this right requires a dedicated data model for tier metadata and a calculation engine that enforces propagation by construction rather than by convention. It's an engineering investment, not a UI decision.
Beyond the implementation mechanics, there's a harder cultural question about how organizations respond to confidence tiers when they're implemented well.
The response is not uniformly positive. Some teams welcome the transparency - they've been uncomfortable presenting numbers without acknowledging the underlying uncertainty, and the tier system gives them permission to say what they've been thinking anyway. Other teams resist. They experience the tier system as exposing their work to criticism they were previously shielded from. When their recommendation is tagged with a composite Tier 4 badge, they feel their analytical competence is being questioned.
The resistance is natural but misplaced. The tier system isn't evaluating the analyst; it's evaluating the data provenance. A Tier 4 recommendation built well is more valuable than a Tier 1 recommendation built badly. The tiers describe the evidence basis, not the skill of the person using the evidence. But this distinction is subtle enough that it takes active communication to establish, and without that communication, the tier system gets read as a performance review tool.
Organizations rolling out confidence tiers should expect this dynamic and manage it. The first quarter of implementation is usually the hardest - teams are adjusting to the new transparency and finding their footing. By the second or third quarter, the norm settles, and the tier system becomes part of how work gets done rather than a threat to how work gets evaluated. But skipping the cultural management in the first quarter, or implementing tiers without explaining what they're for, reliably produces pushback that makes the rollout harder than it needed to be.
A final observation about where this is heading.
Confidence tiers are an early implementation of a broader principle I expect to become standard in analytics platforms over the next decade: provenance as a first-class attribute of every data point. The current generation of analytics tools treats data as fungible - a number is a number, regardless of how it was produced. The next generation will treat data as sourced - every number carries its provenance metadata, and the metadata travels with the number through every downstream use.
Confidence tiers are one form of provenance. Source codes (which specific data feed the number came from), capture timestamps (when the number was produced), freshness indicators (how recently the source was updated), and lineage records (what derivations produced this number from its inputs) are all related. Collectively they turn every number into a self-documenting artifact that can be audited at any point in its lifecycle.
This is a significant change in how analytics platforms work. It adds complexity to the data model, storage requirements, and query performance. The payoff is that decisions made on the data become defensible in ways they're not defensible today. When a strategic recommendation gets challenged five years later - "how did you arrive at that number?" - the system can produce the answer with evidence, not with memory.
Organizations that invest in provenance-first architecture will, over time, have analytical infrastructure that's qualitatively more useful than organizations that don't. The confidence tier system is a starting point for that investment. Get it right and the broader provenance capability follows naturally. Skip it and the gap widens.