
Every distributor P&L model I've ever seen has a line called "working capital" that the builder treats as a manageable cost of doing business. They calculate it as a percentage of revenue, stabilize it over time, and move on. That treatment is correct for market leaders with predictable sell-through and established brand pull. For challengers in the market development phase, it is the single most dangerous assumption in the entire model.
Here's what actually happens. A challenger distributor - call them any FMCG or lubricants operator trying to build share against an entrenched incumbent - enters a territory with 200 target outlets, most of which they don't yet list in. To win the listing, they offer credit terms. Not because they want to, but because every other principal in the category has already offered them. The retailer pays their existing suppliers in 40 days and has no particular reason to pay the new entrant faster. In practice, the distributor ends up extending credit to 60–80% of new outlets on terms that average 60–75 days.
Simultaneously, the bad debt rate rises. New outlets are unfamiliar credit risks. The distributor doesn't have the payment history to distinguish a reliable outlet from a marginal one. What looks like 1.5% bad debt for a market leader runs 3–8% for a challenger in Phase 1 of market entry.
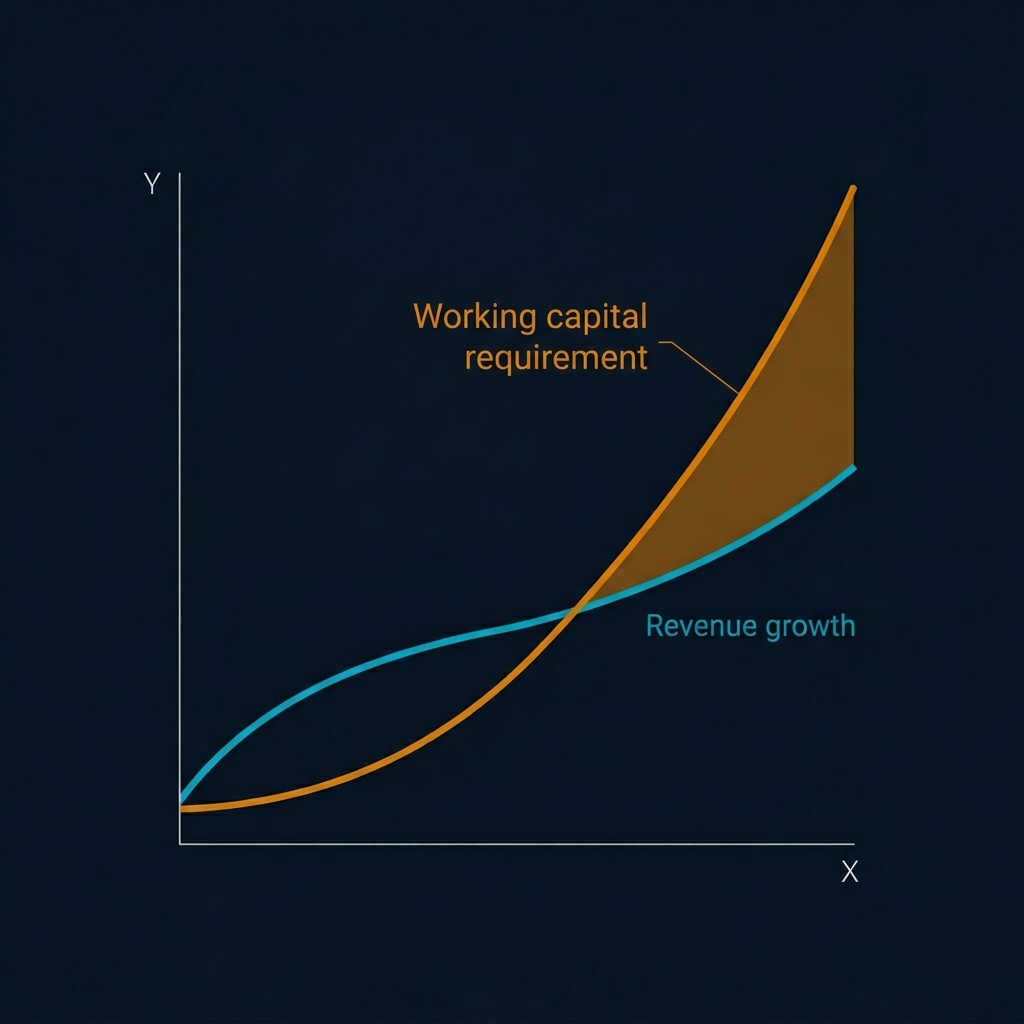
Now compound these three things: higher credit penetration, longer collection cycles, and higher write-offs. Each one on its own is manageable. All three at once are not. They don't add - they compound. Working capital locked up in uncollected trade receivables grows faster than revenue grows. Cash flows out of the business faster than it flows back in. The distributor starts to ration inventory to preserve cash, which means stock-outs at the outlets they worked so hard to list in, which means those outlets drop them for the incumbent, which means the receivables they extended were for relationships that no longer exist.
I have seen this play out, on paper, dozens of times. The executive presentation shows a distributor with 18% gross margin, 8% operating margin, apparently healthy ROIC, and a manageable working capital requirement of - let's say - MYR 300k. The territory is approved. The distributor signs. Six months later they're asking for support. Nine months later they're asking for bailout pricing. Twelve months later the contract is being renegotiated or terminated, and the tenant replaces the distributor, blaming the distributor's management. Everyone moves on.
The distributor's management was not the problem. The model was wrong.
The model assumed a stable float. The reality was a dynamic, compounding, non-linear increase. The distributor who looked viable at MYR 300k working capital actually needed MYR 600–900k to fund the development phase before the territory stabilized. They never had it, because no one told them - including the tenant, whose own viability model assumed the static float. They ran out of cash before the market developed.
This failure is so common, and so consistently misattributed, that I want to be precise about what's wrong with the standard model and what the corrected model looks like.
The standard model treats C11 (trade receivables) as a linear function of revenue. It calculates C11 as something like: (monthly revenue) × (credit penetration %) × (collection days / 30). In a mature territory those three inputs are stable, so C11 scales with revenue in a predictable way. The math works.
The corrected model treats the three inputs as dynamic variables that each spike together in challenger phase, and models them as a compound rather than linear effect. Credit penetration is a curve, not a constant - 30–40% at steady state for a market leader, 60–80% during challenger launch, and it drifts down as brand pull builds over 18–36 months. Collection days are similarly dynamic - 35–45 days at steady state, 60–90 days in development, trending down. Bad debt is a function of outlet relationship maturity, not a category average.

The arithmetic matters. At market-leader baseline you might have: 35% credit penetration × 40 days average collection × 1.5% bad debt. At challenger Phase 1: 70% credit penetration × 65 days average collection × 5% bad debt. The C11 multiplier isn't 2× - it's 2.7× for receivables and 3.3× for bad debt, compounding to roughly 2.5–3× the total working capital requirement of the "stable" model.
There are three design implications for anyone building or using a distributor viability model.
First: always present the two models side by side. Show the static model. Show the dynamic model. Show the difference. Make the tenant - or the investment committee, or the board - explicitly acknowledge which one they are choosing to use, and why. This prevents the most common failure mode, which is that the static model gets used because it shows the better number, and no one ever revisits the assumption.
Second: flag every challenger territory as HIGH RISK for C11 and require senior review before the viability calculation is accepted. This isn't a bureaucratic checkbox. It's an acknowledgment that C11 in challenger markets is the primary cause of distributor failure, and that a junior analyst running the spreadsheet will miss it every time. Someone who has watched a distributor die from receivables needs to sign the number off.
Third: treat total working capital (C12 = C10 + C11) as a capital requirement, not a P&L cost. This is subtle but important. Capital requirement determines whether the distributor can fund the relationship. P&L cost determines whether it's profitable. A distributor can be profitable on paper and still fail because they run out of cash. The two tests are separate and both must pass. Don't conflate them.
A final observation. The receivables trap has a structural parallel in other commercial contexts - SaaS companies in long-sales-cycle enterprise markets, contractors waiting on progress payments, exporters extending long-dated credit across currencies. In every case, the failure mode is the same: static working capital assumptions meet dynamic receivables reality, and the gap bankrupts a business that looked healthy.
The fix is the same too. Model the dynamics explicitly. Present both cases. Make the choice of assumption a visible decision, not a hidden default. And when the numbers don't agree, believe the more conservative one until you have earned the right to believe the optimistic one.
The market leaders have earned that right. Challengers have not. Treating them identically is how challenger distributors go broke on paper-profitable businesses.
Before closing, I want to address the question that comes up every time this framework is presented: how do you get credible numbers for the dynamic variables when historical data doesn't exist? A challenger launching in a new market by definition has no payment history. How do you forecast collection days? How do you estimate bad debt?
The honest answer is that you estimate with ranges and confidence tiers, and you update continuously as data arrives. Credit penetration can be estimated from category norms in similar market positions - AI benchmarks work well for this because the structural dynamic is consistent across categories. Collection days can be estimated from the tenant's experience in analogous markets, or from the shared distributor's existing collection experience if one is available. Bad debt is the hardest to estimate upfront and the most important to monitor - start with the challenger Phase 1 range (3–8%) and track it monthly so that the actual rate is known by month three and can replace the estimate.
The key discipline is that these estimates are visible, tagged as estimates, and scheduled for replacement as data arrives. Not baked into a single number that never updates. Not forgotten about after the first business case is approved. The dynamic receivables model is itself dynamic - it updates as the territory reveals itself. This is a working discipline, not a one-off analysis.
One more thing: the receivables trap has a cultural dimension that's easy to miss. In many Asian markets, extending credit to trade is viewed as a relationship investment rather than a financial exposure. The distributor's owner sees the outlet owner as someone they'll know for twenty years; the credit extended is part of that long-term relationship. The receivables trap is doubly dangerous in these markets because the cultural logic resists treating credit as a risk to be priced and managed. The distributor extends credit not because they've done the math and decided it's worth it, but because refusing would damage the relationship.
The platform's job isn't to override this cultural logic. The job is to make the financial consequence of the logic visible. When the distributor's owner sees, in concrete numbers, that their relationship-investment approach requires MYR 900k of working capital they don't have, the conversation becomes different. They may still choose to extend the credit - but now they're making a choice with full information, not operating on reflex. That's what the corrected model enables. The trap doesn't close because the model is better. The trap closes because the distributor sees it coming and can choose, for the first time with full visibility, whether to step into it or not.