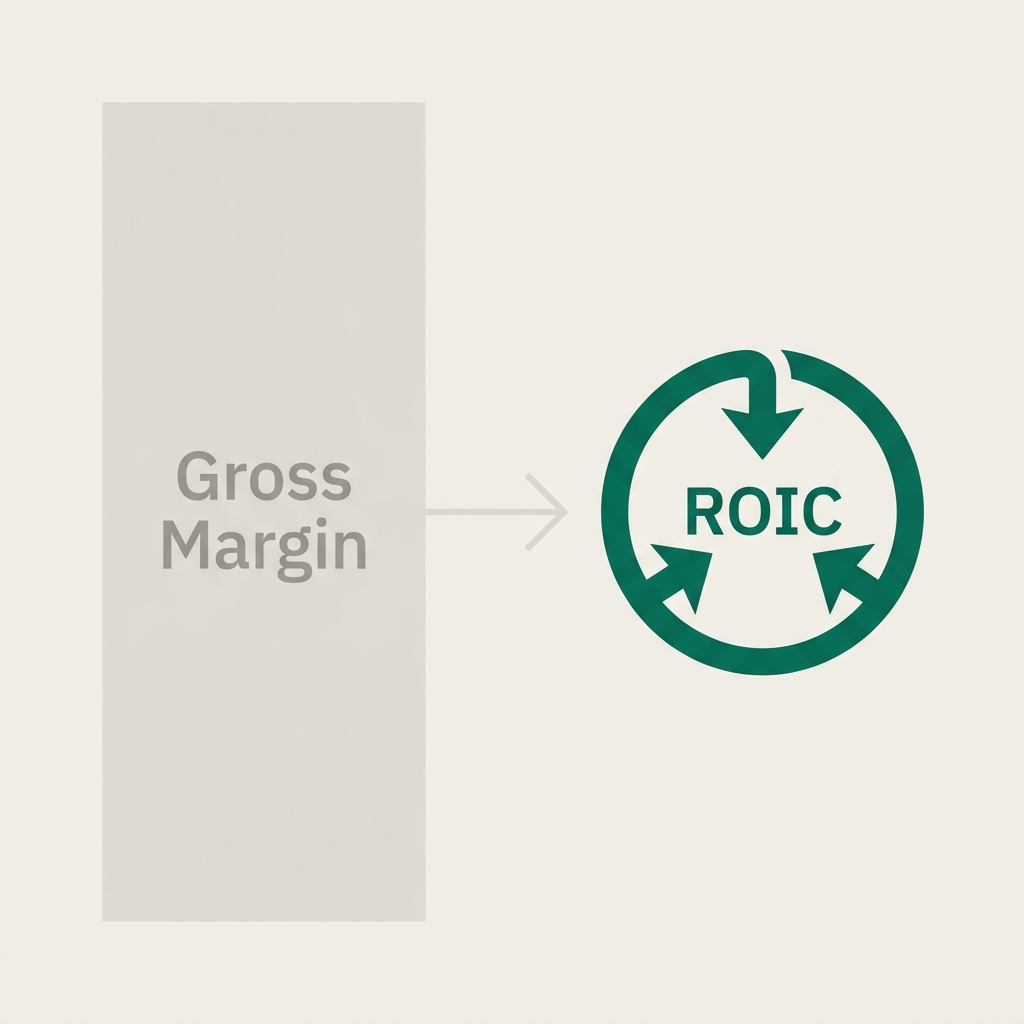
Every FMCG commercial team has a spreadsheet that ranks their distributors by gross margin. It usually has three colours. Green distributors are kept. Amber distributors are coached. Red distributors are replaced or terminated. The spreadsheet feels authoritative. It is updated monthly. It feeds into territory reviews and board presentations. It is almost entirely the wrong tool for the job. Gross margin, as a measure of whether a distributor relationship is worth continuing, is structurally misleading. It describes what happened. It does not describe whether the relationship is economically rational. And those are different questions, and the second one is the one that should drive commercial decisions.
What gross margin tells you, and what it hides
Gross margin is a derived P&L figure. It is what remains after cost of goods sold is deducted from revenue. It is a useful number for understanding pricing discipline, promotional depth, and product mix. It is not a useful number for understanding whether a distributor's working capital, infrastructure commitment, and operating cost structure produce an adequate return on the capital they have invested in your business.
Consider two distributors. Distributor A runs a 22% gross margin on your range. They carry 120 days of inventory across seven SKUs, give 90 days of credit to their top fifteen outlets, and pay their suppliers in 30. Their working capital cycle is 180 days long, and the inventory is aging. Distributor B runs a 14% gross margin on the same range. They carry 40 days of inventory, give 30 days of credit, and negotiate 45 days from suppliers. Their cash conversion cycle is 25 days. On the gross margin spreadsheet, Distributor A is green and Distributor B is amber. On an ROIC calculation, Distributor A is generating roughly 6% return on the working capital tied up in your range, and Distributor B is generating 34%. Which one is the healthier relationship? The one generating six times the return per dollar invested.
This is not a hypothetical pattern. It is the default pattern in Asia-Pacific distribution, because the distributors with the fattest margins are often the ones who have negotiated those margins specifically because their operational model is capital-intensive. They need the margin to cover the working capital. The margin is not excess profitability. It is structural compensation for an inefficient model. A tenant who rewards that structure - by giving those distributors bigger territories or more SKUs or longer contracts - is optimising for the wrong variable and creating a portfolio of distributors whose economics do not compound.
The three-leg working capital formula
The fix starts with making the working capital commitment visible. Most FMCG commercial teams do not see their distributors' working capital position. They see their own receivable against the distributor, and they see the distributor's volume history. They do not see the inventory the distributor is sitting on, the receivables the distributor has outstanding against downstream outlets, or the payable runway the distributor has with their own suppliers. All three matter, and they combine into a single three-leg formula.
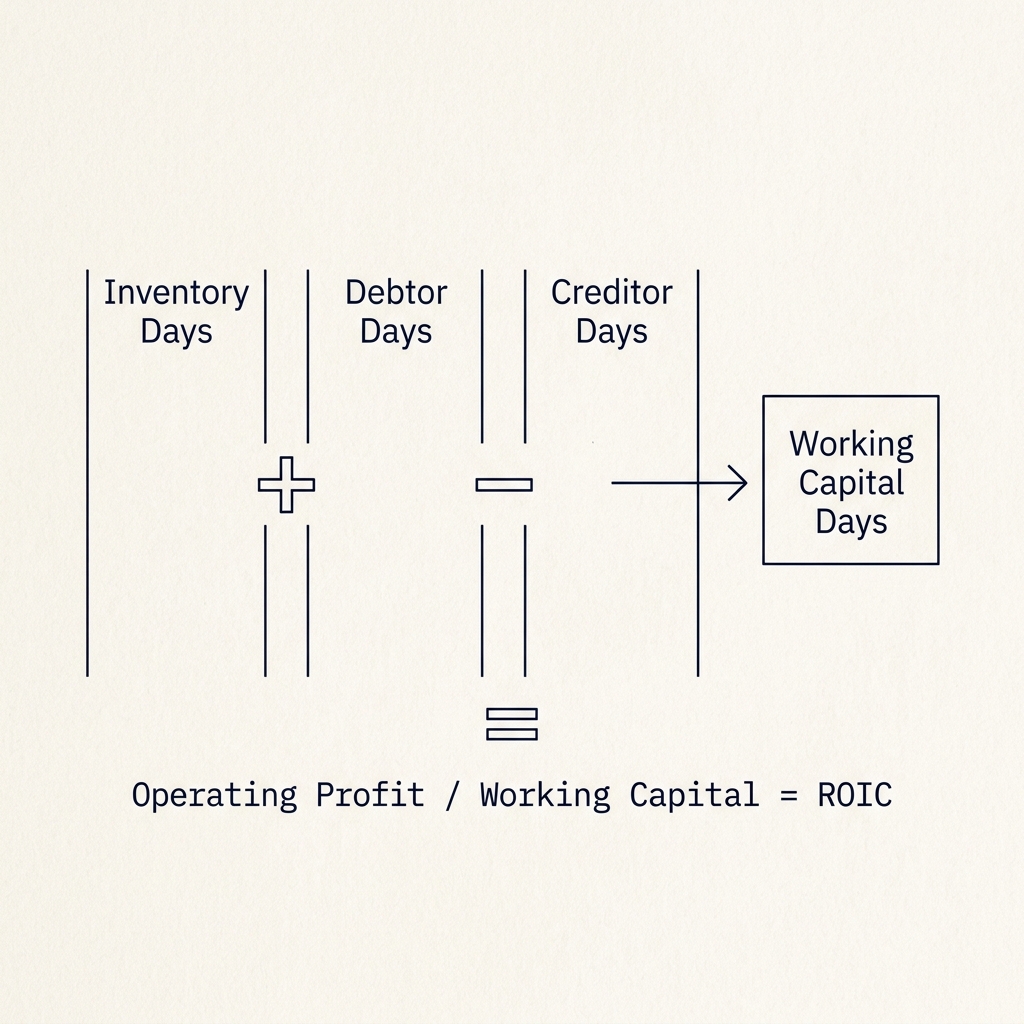
Inventory days plus debtor days minus creditor days equals the number of days of working capital the distributor has tied up in your business. A distributor with 90 days of inventory, 60 days of outstanding receivables, and 30 days of supplier credit is carrying 120 days of working capital. Revenue per year divided by 365, multiplied by 120, gives the dollar value of that working capital commitment. That number is the denominator of the ROIC calculation, and most FMCG commercial teams have never calculated it for their distributors.
With the denominator in place, the numerator is operating profit - gross margin, minus the distributor's operating cost structure (salaries, warehouse, fleet, administrative overhead, financing cost on the working capital). Operating profit divided by working capital invested gives ROIC. Compare ROIC to a market hurdle rate - the distributor's weighted average cost of capital plus a risk premium for your category - and you have an economic verdict. Is this relationship generating returns above the hurdle? If yes, it is worth continuing, and potentially worth expanding. If no, it is destroying value for the distributor and will eventually destroy the relationship.
Why this changes the conversation
The standard FMCG distributor conversation is about margin. The distributor asks for more margin. The tenant negotiates. A compromise is reached. The relationship continues on slightly worse terms than either side wanted, and both sides feel they did not get enough. This pattern repeats every year, because margin is the only variable both sides are discussing.
The ROIC conversation is different. The tenant opens the meeting by showing the distributor their own ROIC calculation against the category hurdle rate. If the distributor is below hurdle, the conversation is about why - which leg of the working capital cycle is bloated, which operating cost is out of line, which category of inventory is aging. These are specific, operational conversations. They produce specific, operational actions. A week of supplier renegotiation, a consignment inventory trial for a specific SKU category, a credit policy tightening on a specific outlet tier. Each of these moves the ROIC number in a measurable way.
If the distributor is above hurdle, the conversation is about how to extend. What additional SKUs would expand the working capital base productively? What adjacent territory could absorb additional DSR capacity? Which outlet tiers could tolerate a slightly extended credit policy in exchange for larger order commitments? The relationship deepens because both parties are looking at the same economic framework and negotiating moves that benefit both.

The board-level implication
There is a reason ROIC is the metric that sophisticated capital allocators use for every other business decision - M&A, capacity investment, product launches, territory expansion - and it is the metric distributor management should use as well. It is the only metric that honestly answers whether capital is being deployed productively. The reason most FMCG companies don't use it for distributor management is not that it is harder to calculate. It is that nobody has built the system that can calculate it. The data lives in different places. The distributor's inventory position is in their system, not yours. The receivables aging is in their accounts, not yours. The operating cost structure is in their P&L, not yours.
When a platform can ingest all three data sources - distributor-submitted inventory, tenant-side receivables, shared trade terms, and operating cost benchmarks - the ROIC calculation runs automatically. Every distributor has an ROIC score that updates as the underlying data refreshes. The portfolio view replaces the gross margin spreadsheet. The decisions get better. The relationships that deserve to scale, scale. The relationships that cannot generate adequate returns, get restructured or retired before they become a problem. That is what a commercial operating system does that a CRM cannot.