The first version of the territory model was clean and wrong. Each territory was a named group of districts with its own market size (R1), its own distributor P&L, its own position on the attractiveness-versus-ability-to-win matrix. You could open a territory, look at its numbers, decide whether it was viable, and move on. The UI mirrored the data model: a list of territories, each with its own detail page.
Two problems emerged almost immediately.
Problem one: double counting
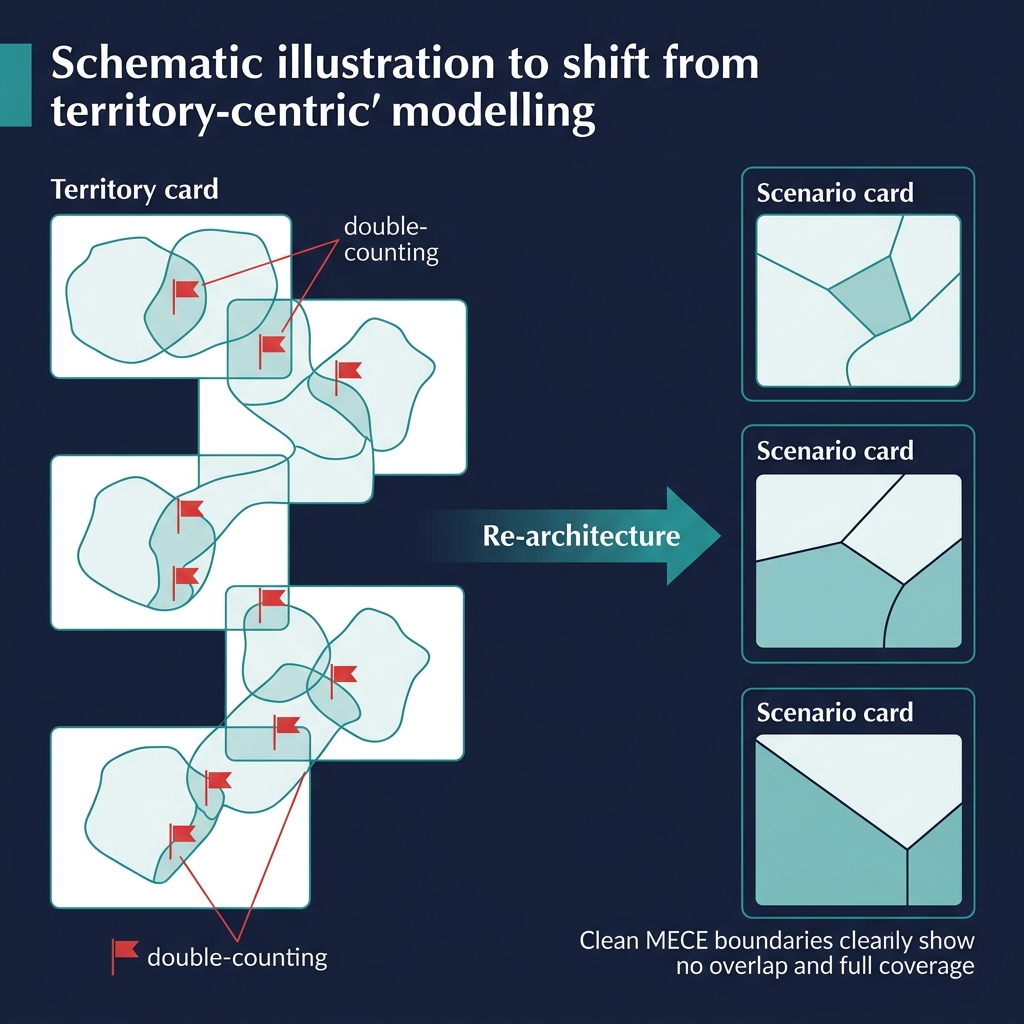
In real route-to-market deployments, territories overlap. A border district between Klang Valley and Northern Corridor belongs geographically to whichever territory the senior partner decides includes it - but the decision is rarely binary. A shared wholesaler might serve outlets on both sides. A distributor covering one territory might have informal reach into the other. When the spec said "territory equals a set of districts", the implementation ended up with districts appearing in multiple territories simultaneously.
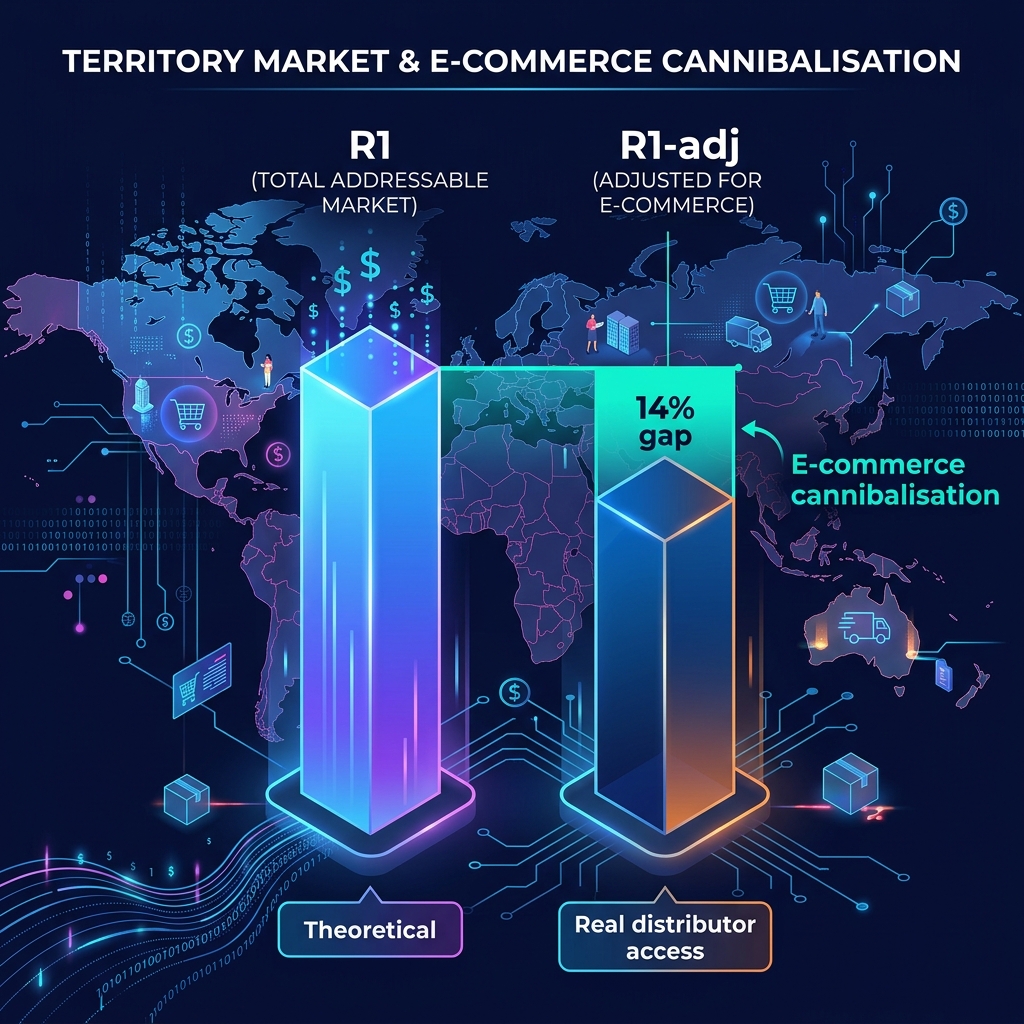
The formulas didn't care. R1 was calculated per territory by summing district-level addressable volume. If a district appeared in two territories, its full R1 potential was counted in both. The national sum of territory R1s exceeded the national R1 - sometimes by 15%, sometimes by more. Every downstream calculation inherited the error. Distributor P&L overstated revenue potential. Return on invested capital looked higher than it was. Territories that should have been flagged as "at risk" showed as "viable" because the inflated R1 made the numbers work.
The fix isn't complicated - de-duplicate districts across territories, flag overlaps, force the senior partner to make a call. But the underlying question is harder. What is the right unit of analysis for route-to-market design? A territory, considered alone, doesn't answer a business question. A CEO doesn't ask "is Klang Valley viable?" They ask "if I deploy these four territories covering 62% of my national market, what do I get, what does it cost, and how many distributors do I need?"
Problem two: no coherent coverage picture
The second problem was more fundamental. Looking at territories one at a time, you could never answer the coverage question. The platform had no concept of a territory set as a unit of analysis. You could export six territories to a spreadsheet and add them up by hand, but that's not a product - that's a worksheet. And the addition was wrong anyway, because of the double-counting problem.
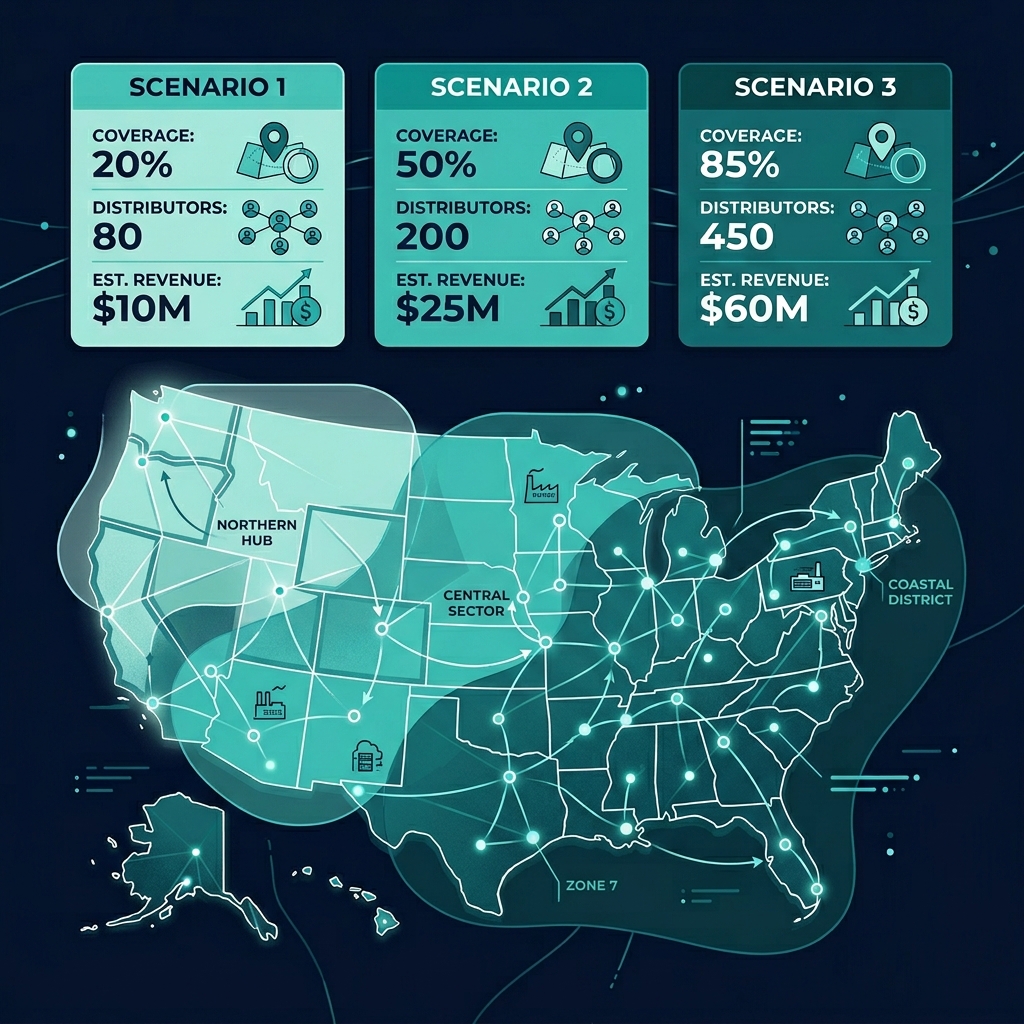
More importantly, the coverage question isn't just additive. A four-territory scenario covering 62% of the national market with three distributors isn't the same as a six-territory scenario covering 78% with five distributors. The first has lower absolute reach but higher per-distributor productivity and lower coordination cost. The second has wider coverage but thinner distributor economics and more complex governance. These are different commercial propositions, not just different rows in a table. A CEO choosing between them needs to see them as wholes, not as sums of parts.
The fix: scenarios as a first-class entity
We introduced a new entity: the Scenario. A scenario is a MECE - mutually exclusive, collectively exhaustive - grouping of territories that answers the coverage question as a whole. Districts belong to exactly one territory within a scenario. National coverage is the sum of territory coverage, with no overlaps. Distributor count is the count of distributors across all territories in the scenario. National sell-in projection is the sum of territory sell-in, correctly added. Every number adds up the way it should, because the data model enforces MECE-ness at the scenario level.
More than a technical fix, this changed how we thought about the product. A territory became a building block. A scenario became the commercial proposition. The SP's primary unit of decision-making shifted from "is this territory viable?" to "does this scenario deliver the aspiration?" Territories still matter - they're where the distributor P&L lives, where the DSR count is calculated, where the outlet archetypes are defined - but they're no longer the top-level unit of analysis. Scenarios are.
The UI followed. The landing screen for an engagement now shows scenarios as cards: three MECE options, each showing territory count, national coverage percentage, distributor count, and aggregate viability summary. Clicking into a scenario reveals its territories. The territory list is no longer the first thing a user sees; it's the drill-down.
The broader pattern
This experience pointed at something more general. When you build a platform around the most obvious unit of data - in our case, the territory, because that's the thing you draw on a map - you often miss the unit that matches the actual business question. The business question here wasn't about individual territories; it was about coverage scenarios. The platform's first architecture encoded the wrong abstraction at the wrong level.
The pattern repeats across enterprise software. Salesforce made Accounts the primary unit, but the real business question is often about Account Relationships (supplier-customer, parent-subsidiary, partner-to-partner) - which is why so much Salesforce customisation work is essentially building a shadow entity on top of Account. Figma made Files the unit, then realised Design Systems were the real unit for enterprise buyers. Airtable made Tables the unit, then added Interfaces because the real unit was the business workflow, not the schema.
The move is the same in each case. Identify the unit of analysis that matches the decision the user is actually making. Make that unit a first-class entity in the data model. Let the old obvious unit become a building block, not the top level. It's a painful migration when you do it late, and it's the single most impactful architectural decision most platforms make.
What the migration looked like for us
Adding scenarios wasn't a schema change in isolation. It was a redefinition of MECE constraints across every territory-touching entity: districts belong to one territory per scenario, distributors are assigned at the territory level within a scenario, market sizing rolls up from territory to scenario, the two-by-two matrix is scenario-scoped. Every formula that previously summed territories had to be re-audited for scenario-awareness. Every UI that listed territories needed a scenario selector. The data migration was cautious - existing territories became a single implicit scenario per engagement, preserving history while making the new model canonical going forward.
It was four weeks of work that should have been one week of work if we'd gotten the unit of analysis right at the start. That's the cost of the pattern. It's also why, when we designed Modules 2 and 3, the first question we asked for each was: what is the unit of analysis here? For Module 2 (JBP and live tracking), it's the annual joint business plan, scoped to a distributor-territory pair. For Module 3 (field execution), it's the DSR-week - the combination of a specific DSR's planned visits over a week against actual completion. Get the unit right, and everything else follows. Get it wrong, and you spend months grafting the right abstraction onto a model that doesn't want to hold it.